
Your team has pushed the performance optimization sprint three quarters in a row. Not because anyone thinks it doesn’t matter, but because something else was always on fire: a feature launch, an integration deadline, or a bug that a stakeholder won’t stop emailing about.
Meanwhile, the data keeps piling up. In 2020, Deloitte and Google studied 37 brands across 30 million user sessions. They isolated site speed as the variable. No UX redesigns. No feature changes. Just speed. They found that a 0.1-second improvement in mobile load time lifted retail conversions by 8.4% and average order value by 9.2% per tenth of a second.
Shopify’s April 2026 platform-wide analysis confirmed it: even on a platform where nearly 80% of stores already pass Core Web Vitals (CWV), every 100 milliseconds slower costs roughly 3.5% in conversion. Two independent datasets, six years apart, agree on what matters: every fraction of a second carries a price. The magnitudes differ. A controlled retail sample shows a steeper effect than a platform-wide average, but the direction never does.
Performance optimization is the highest-ROI work that consistently loses to the roadmap. This article is about why, what it’s costing, and what the fix looks like.
Four Numbers That Make the Case
There are plenty of stats about site speed floating around the internet. Most of them are poorly sourced, outdated, or both. These four are traceable, and each one adds a different dimension to the same argument: slow is expensive.
| # | What it measures | The number | Source |
| 1 | Page load abandonment on shopping sites meeting CWV | 24% less abandonment | Google / Chromium Blog, 2020 |
| 2 | Bounce rate at 2s vs. 5s load time | 9% → 38% | Pingdom, ecommerce sample, 2018 |
| 3 | Organic traffic loss for sites with LCP > 3 seconds | 23% more, observed | Search Engine Land / Amsive, March 2026 |
| 4 | Ecommerce revenue in Nov-Dec | ~25% of annual GMV | Klaviyo, 2024 |
1. The Abandonment Gate
Google analyzed millions of page impressions using Chrome data and published the results on the Chromium blog in 2020. Shopping sites that met all three CWV thresholds experienced 24% fewer page load abandonments. These are people who leave before the page finishes loading. They never see the product. They never see the price. They’re gone before you had a chance.
On any site with meaningful traffic, 24% fewer people walking away at the front door represents a revenue gate you didn’t know was closed.
2. The Bounce Curve
Pingdom published data from their monitoring platform in 2018, sampled across ecommerce sites. At a 2-second page load, 9% of visitors leave before engaging. At 5 seconds, that number is 38%.
The thing to notice isn’t the individual numbers. It’s the curve. Going from 2 to 3 seconds doesn’t cost you as much as going from 4 to 5 seconds. Every additional second costs more than the last. Pingdom’s data is from 2018, but the relationship it captures is durable. The curve is exponential, not linear. Every major study since then, including those cited in this post, confirms the same pattern: the cost of each additional second of load time accelerates.
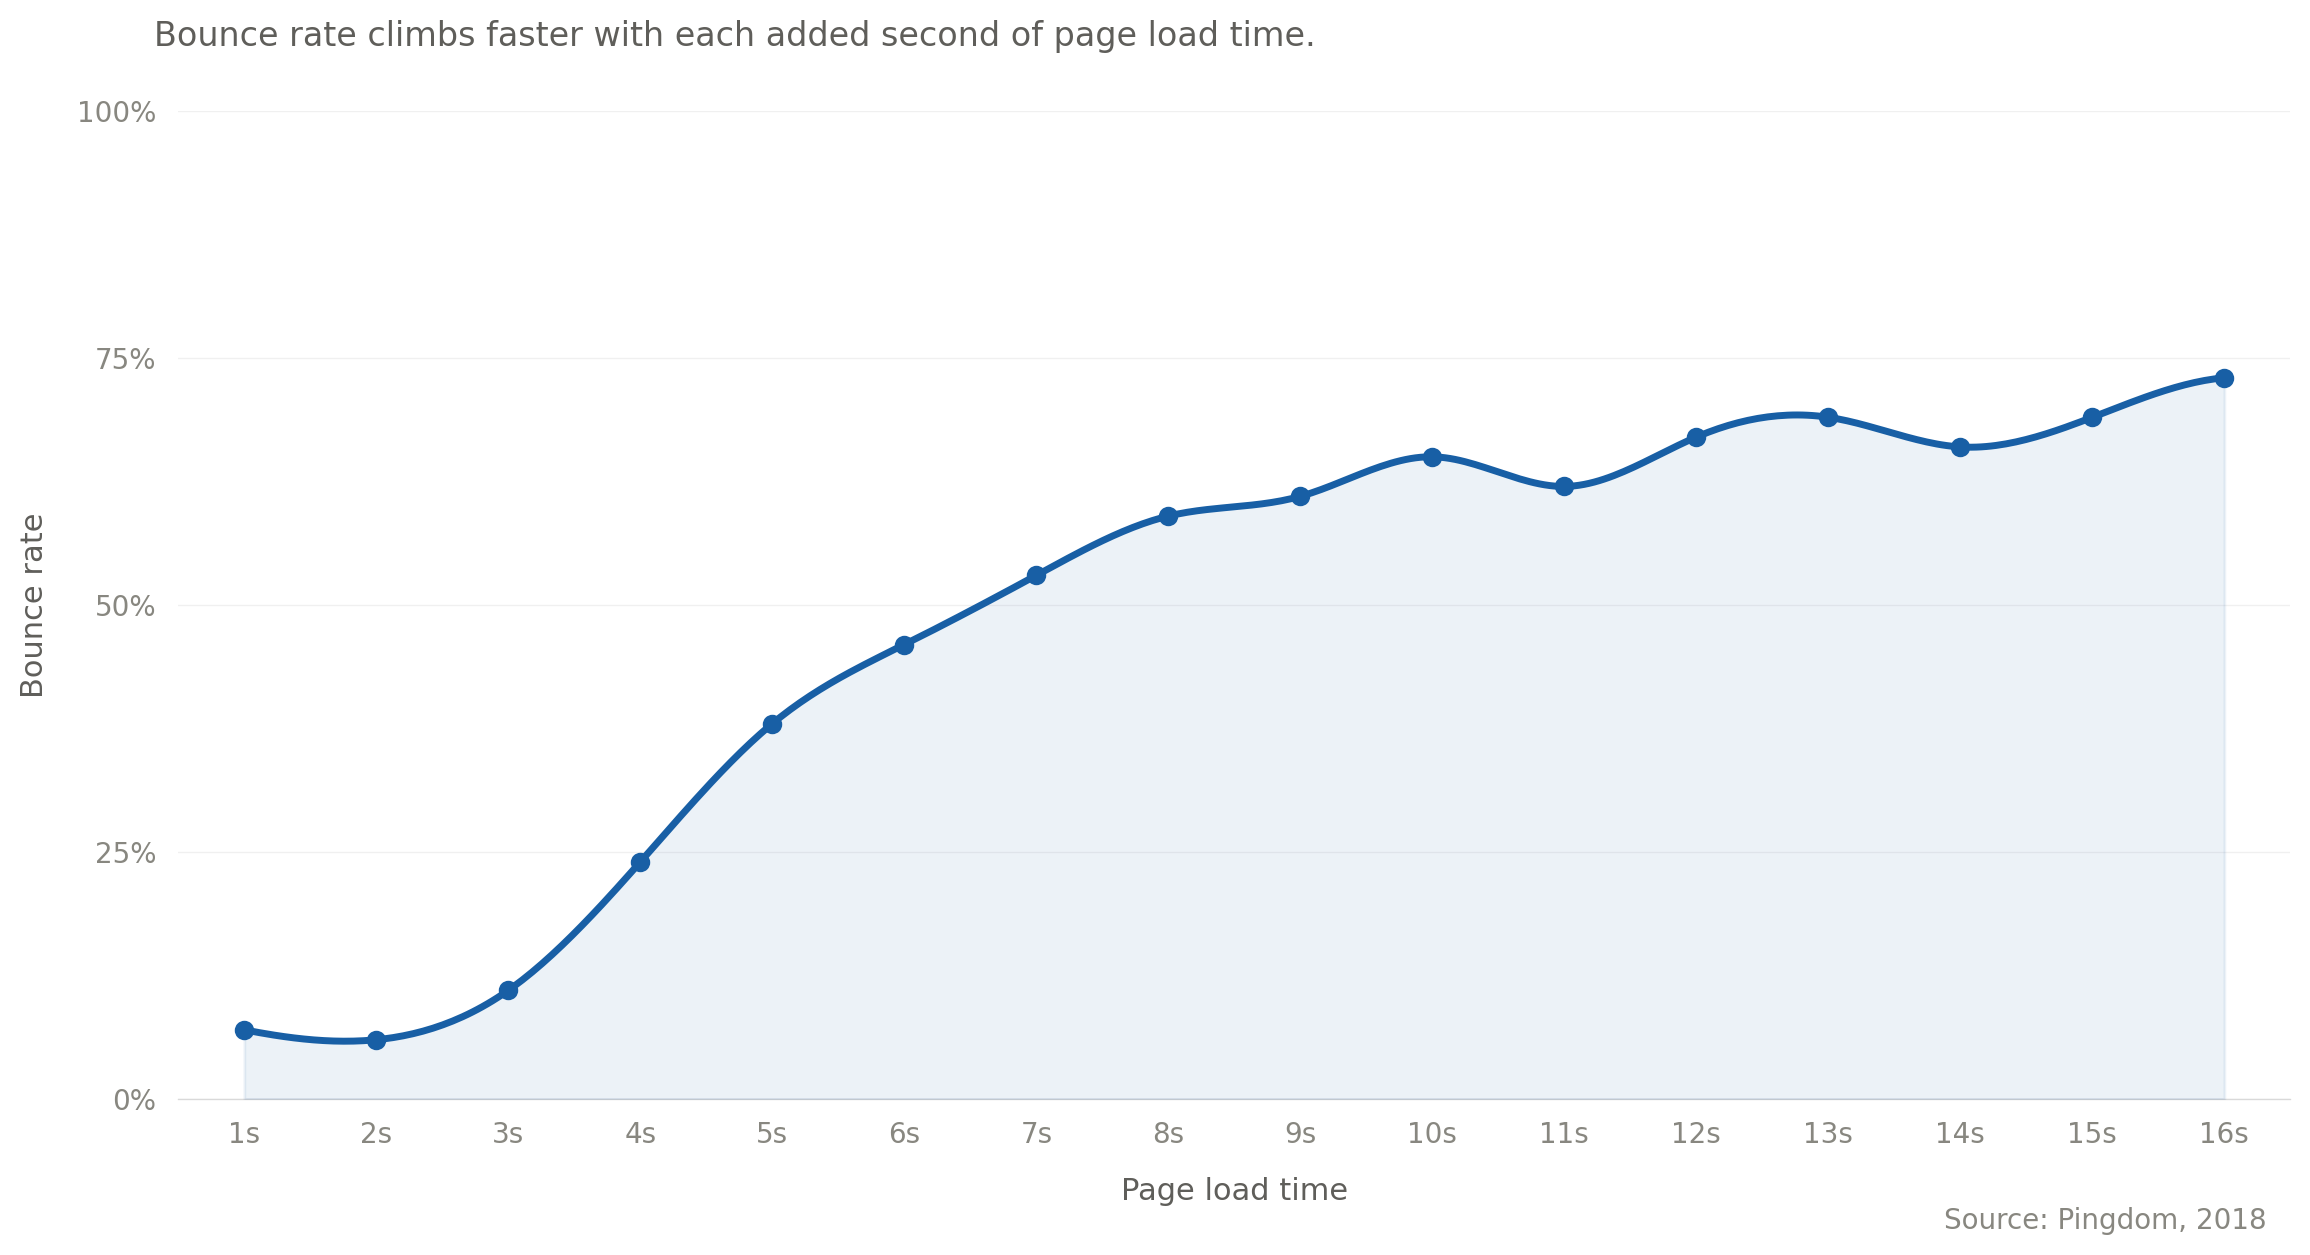
By the time your page loads at 5 seconds, you’ve lost more than a third of the people you paid to bring there.
3. Performance is now a Customer Acquisition Cost (CAC) Problem
For years, site speed was a UX conversation. It lived in the engineering team. It showed up in quarterly reviews as a “nice to improve” metric. That’s changing.
Google rolled out a core update in March 2026. Industry analysis from Search Engine Land, Amsive, and others showed a consistent pattern: sites with poor CWV experienced disproportionate ranking losses. One analysis found sites with LCP above 3 seconds lost 23% more organic traffic than faster competitors.
Google hasn’t officially confirmed that it increased the weight of CWV in ranking. But the observed pattern is consistent with performance playing a larger filtering role. And the practical impact is the same either way: slower sites rank lower. Lower ranking means less organic traffic. Less organic traffic means buying more paid traffic to make up the difference.
This used to be a UX line item. Now it’s a CAC problem.
4. Peak Season Amplification
Klaviyo’s 2024 data shows roughly 1 in 4 ecommerce dollars are transacted in November and December. For seasonal categories, it’s more concentrated. In Klaviyo’s merchant survey, 28% of merchants reported that peak season accounts for 30-50% of their annual revenue.
Now think about when your marketing spend is highest: it’s the same window of time, from November to December. You’re running the most ads, driving the most traffic, investing the most in acquisition during the exact weeks when performance optimization matters the most.
If your site is slow during peak, you’re not just losing customers. You’re paying to lose them.
The Bottom Line
These four numbers are not theoretical. Every one of them is measurable on your site today. The question is whether you’ve measured them and what you’re going to do about it.
Why It Never Gets Fixed
Every commerce team agrees performance optimization matters, yet it always gets pushed to the back burner, not from a lack of willpower or doubt about the ROI, but because of a structural pattern that constantly blocks it.
It’s always the first thing cut. When engineering capacity tightens (and it always tightens), performance work is the first sprint to get pushed. Feature launches have deadlines. Bug fixes have stakeholders. Integration work has partners waiting. Performance doesn’t have anyone screaming about it today. So it waits. And while it waits, the cost compounds quietly. Every week of delay is another week of lost conversions, higher bounce rates, and degraded rankings.
Entropy is undefeated. Sites that aren’t actively maintaining performance lose ground over 12-18 months. Third-party tags accumulate. CMS content grows. Marketing adds tracking pixels. Plugins get installed. Nobody removes anything. The site gets slower one decision at a time, and no single decision is the problem. By the time someone runs a Lighthouse audit and sees a red score, the causes are spread across dozens of changes made by a dozen different people over a year.
It’s specialized work. Performance optimization follows a different pattern than feature development.
Diagnose → Fix → Validate
You need to understand render pipelines, CWV mechanics, the impact of third-party tags, image delivery chains, and layout shift sources. Most engineering teams don’t maintain this skillset because they don’t use it often enough. That’s not a criticism. It’s a capacity reality. You wouldn’t expect your feature team to be experts in something they do once a year.
The in-house cost comparison is usually wrong. Teams assume that doing it internally is cheaper. The math rarely supports it when you account for the full cost: engineering opportunity cost (what your team isn’t building while doing performance work), roadmap delay, context-switching overhead, and the ramp-up time for engineers who don’t do this work regularly. It’s worth running the actual comparison before deciding.
You’ve been here. Not because you don’t care, but because something else was on fire. There are times when it’s genuinely not the right move: You’re about to replatform, your traffic is too low to justify it, or the bottleneck is server-side. Knowing when to skip it is part of the expertise. But for most ecommerce teams, the structural gap between knowing and doing has a structural fix. It does!
What Closing the Gap Actually Looks Like
If the optimization gap is structural, the fix needs to be structural too. Not a one-time audit that generates a PDF nobody reads or a Jira ticket that gets deprioritized every sprint. Aries Solutions offers a bounded engagement with a clear methodology and measurable outcomes.
We run an 8-week engagement that includes:
- a baseline scan
- prioritized backlog
- sprint-based fixes through your pipeline
- checkpoint scans at every release
- a final report with before-and-after evidence
- a 30-day Chrome User Experience Report (CrUX) follow-up to confirm the gains hold in the real world.
Your engineers approve the code. We do the work. The principles are straightforward.
Bound it. Performance optimization work without a deadline becomes a backlog forever. Aries sets a fixed window. Eight weeks with a start date, end date, and measurable outcome.
Measure the same way every time. A baseline, deployment checkpoint, and final scan document the outcomes. We use the same pages, the same methodology, and the same tools throughout, with no goalpost moving.
Prioritize by impact, not by ease. Every finding is sized by its impact and the engineering effort to fix it. We collaborate with your team to ensure the highest-impact, lowest-effort fixes ship first.
Run alongside the roadmap, not instead of it. Performance optimization work should use the team’s existing engineering pipelines. Aries uses the same PR review process and the same deploy pipeline, with your engineers on the team approving the code. The optimization is running parallel to feature development, not competing with it.
Name the exceptions honestly. If a finding points to a backend (server response time, infrastructure constraints, database performance) or a UX problem, our team will flag it for a follow-up discussion with your team.
When Vodafone cut LCP by 31%, sales rose 8% in a controlled A/B test. It’s time for your business to reap the same benefits and more.
The Loss Is Bigger Than It Looks
The revenue you’re leaving on the table is bigger than it looks. A lost conversion isn’t just a lost order. It’s the repeat purchase that never happens, the email that never fires, and the subscription that never starts. It’s a lifetime of spending that never begins.
So run the number. Take what your average customer spends in their first 60 days. That is lifetime value, not average order value, and 60 days is the floor, not the ceiling. Multiply that by the conversions slow performance is costing you. You already know the first number. The second takes a scan to measure against your real traffic. The missed order is the part you can count. What it would have compounded into is where the money actually goes.
The four numbers at the top of this article settled whether performance work pays for itself. What they don’t settle is whether your team has the room to capture it. Most don’t.
The roadmap is full, and conversion work is the first thing deferred when it gets tight. That’s where Aries comes in. Commerce performance is our practice, so we bring senior people who fix what’s actually costing you conversions, measured against the number you just ran. No replatform you don’t need, no vanity metrics, and no long ramp. You’ve got the number. We’re how you act on it before another quarter of it is gone.